After a very interesting and exciting overnight, the metals are pulling back a bit this morning. This will present some opportunity if we interpret things correctly and are prepared.
As mentioned last evening, The POSX and the long bond are both up today on the bad news of the U.S. downgrade. That makes a lot of sense, doesn't it? However, as of this morning, the U.S. dollar is still the world's reserve currency and, consequently, it still receives the "flight to safety" bid. It's all short term nonsense and we're not too concerned with the short term around here. Today's short term trade in gold and silver are also of little consequence. Well, I shouldn't say that. They are of major consequence if you're looking to buy and add to positions today. In the long term, though, where gold is trading this instant has zero impact on where it will be one month from now or six months from now.
Let's start with silver. DO NOT FORGET THIS: Margins in silver are now quite high relative to gold and open interest is still down 20% from late April. This implies two things:
1) Buying tends to dry up after thrusts higher. We've seen this over and over again for the past three weeks. This lack of follow-through allows the monkeys to come in and easily beat it back.
2) The current silver longs are what we consider "strong hands" that aren't easily frightened and most have a cost basis back in the mid-30s.
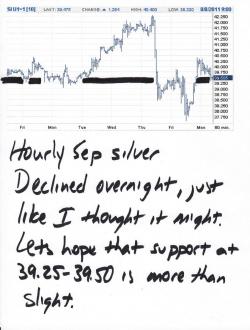
Taken together, you get a silver market that is consistently moving two steps forward and one step back. Actually, it's more like three steps forward and 2 steps back! Expect this to continue into the near future. For today, silver is over $1 off its highs and has pulled all the way back to 39.10 as I type. The chart I'm posting below is already obsolete but I'll post it anyway.
Gold is where I'm most interested these days and, boy oh boy, are these charts interesting. First up, let's revisit the weekly chart that Trader Dan gave us a few days ago. Note that gold is now clearly above the top trendline, which looks to be somewhere between 1680 and 1685.
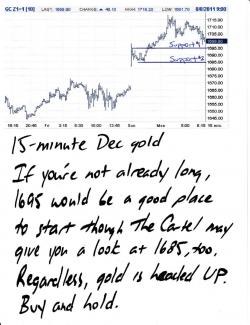
1685. Keep that number in mind. OK, now look at a 15-minute chart. 1695 looks to be your initial support but there's 1685, waiting to contain the downside for us.
Now look at an hourly chart. Remember how gold first touched that top channel line on the weekly chart back on Thursday? Do you also remember the old adage about "what was resistance is now support"? Well, you can see it quite clearly here:
And for good measure, here's an 8-hour chart which takes us back to the beginning of this move last month. Let's watch the upper boundary line very closely as it already has served to contain last night's rally.
I see that things have perked up nicely since I last checked 15 minutes ago. Gold is back to 1703 and silver is back to 39.47. I haven't made any trades yet today and I don't plan to. I am, however, watching that Sep silver spread of mine very closely.
Have a fun day. More later. TF
P.S. Time for another contest. Please post your guess for the Comex closing price of the September gold contract for this coming Friday, the 12th. The winner gets a hat!!


