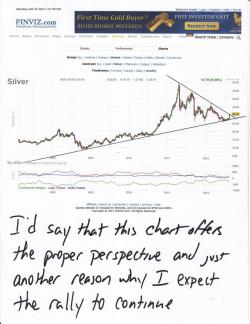
We had an awesome week and the charts look great. More importantly, a fire has begun that will eventually consume the entire House of Lies.
At first glance yesterday, the CoT hit me like a punch to the gut. I was wrong about something and I hate being wrong. You see, as last week progressed, I became increasingly convinced that JPM's massive silver short position was coming under assault by the other "commercials". I likened this idea to a pack of hyenas sensing the weakness of the leader and turning upon him. Clearly the report, which shows positions as of last Tuesday, does not support this analogy.
Yet.
Instead of attacking the leader, the pack chose to support the leader, instead. All of the buying in the 8/15-8/21 timeframe came from the specs, both large and small. All of the selling (to the tune of net short 9000+) came from The Forces of Darkness. The Evil Ones unloaded 4651 of their longs (10%) and added 4424 brand new shorts. (For those keeping score at home, that's about 22,000,000 ounces of paper "silver" created out of thin air.) Never fear, Captain Metaphor is here with a new one for you to consider.
The action last week is akin to the actions of an arrogant and drunk homeowner who foolishly built his castle along a tinderbox-dry ridge, confident that his homemade firewall would always protect him. Through the years, his house has stood firm against the elements and the homeowner has grown complacent and comfortable. Last week, the homeowner started down his usual path of preparing for the winter. He has once again begun to stockpile gasoline, liquid propane, kerosene and other accelerants. He places them within his house, confident that he can safely use and remove them at his leisure and blind to the danger a fire would present to his fiefdom.
What he apparently doesn't realize is that a conflagration will soon jump the firewall. His castle, which he thought impervious, will soon be consumed in a fire of his own making.
So, upon further review, I am not the least bit concerned about the makeup of the latest CoT. The homeowner has simply placed himself in greater peril by his actions this week. His house is burning yet he slovenly continues his business. Fat, happy and blissfully unaware of the disaster at hand.

As we prepare for next week, I thought it appropriate to give you these charts. Look very closely at them and they will tell you a lot. Let's take them one by one. First, an up-close look at a weekly silver. Note that the price has apparently closed right on top of the Battle Royale II line. Might a raid come from here? Of course. However, silver closed Friday above all of its moving averages. Every single one. This is very bullish from a technical perspective and will almost certainly lead to a rally on Monday as technical-based, momentum-chasing spec money comes charging in. The next resistance point that I see is near $31.50, which would be well above the BR2 line.
The weekly chart of gold shows that is is clearly above its Battle Royale line and, like silver, gold closed Friday above its 10-day, 20-day, 50-day, 100-day and 200-day moving averages. Once it surpasses 1680, gold will move effortlessly higher toward 1700. (More on that level in a minute.)
And these next two charts should be as reassuring as a hug from an old friend. Note that, after peaking in late April of last year, silver price declined into May of this year, where it began riding higher and consolidating along the long-term trendline. If silver could not be broken down last September, last December or even this May, it ain't gonna be broken down now. Soon, The Battle Royale will be won and silver will move on toward further fights at $33 and $36. For now, though, study this chart and smile.
And while you look at this gold chart, keep in mind that ole Turd very much likes to discover patterns that no one else has yet noticed. Look closely. Gold has followed this channel, this "managed ascent", for nearly four years as part of the larger bull market that began in 2001. Now, look even closer.
Recall that, just yesterday, we discussed the significance of 1665-1675 as it related to the S&P downgrade of the U.S. and The Panic which gripped The Gold Cartel in the weeks that followed. Beginning the following week, gold began to trade uncharacteristically above and outside of its long-term channel. If you count the total amount of time between the breakout UP and the final fall back WITHIN, you get a total of 17 weeks. Fast forward to today. In early May this year, gold fell DOWN and out of its long-term channel. If you count the total amount of time between the breakout DOWN and today, you get a total of 16 weeks. Does this mean that next week is the transition week where price straddles the lower line of the channel, currently near 1700? Will the first week of September bring price action that finally places gold squarely back within the channel? Who knows. But, would you be the least bit surprised by a "candle" this week that lies upon the channel line and a "candle" next week that lies within the channel? I wouldn't be.
Well, that's all for now. Go relax and enjoy your weekend. Do not let the CoT (or anything else for that matter) bother you. Over the past eight trading sessions, silver has rallied nearly 10% and The Evil Empire has not participated. In fact, the have only impeded the rally at their future cost and peril. What is coming will truly be explosive and historic. Like me, you should just remain patient and diligent, adding to your stack whenever possible.
TF


