We've asked a few times now, "what happened on September 1st"? It's time to revisit that question again today.
If you missed the previous two posts, you can find them here:
https://www.tfmetalsreport.com/blog/6120/dancin-september
https://www.tfmetalsreport.com/blog/6155/more-evidence-post-qe-deflation
The basic premise is this:
Beginning in late August, the collective "market" finally began to anticipate to complete removal of overt Fed QE. (By the way, this was confirmed with the October POMO schedule, which shows QE3(∞) "ending" on October 28.) To understand how the "market" looks at this, think back to The Great Financial Crisis of 2008.
Back then, deflation was the big scare/risk. Asset prices were crashing globally and a global economy built upon debt and fractional reserve banking simply cannot survive in a hyper-deflation environment. Thus, QE1, QE2 and QE3(∞). Over the course of those money-printing programs, The Fed created nearly $3T in fresh cash, ostensibly to "help the economy".
Well that spigot will again be temporarily turned off in 26 days and the collective "market" finally began to anticipate just that back in late August. Without the constant dump of fresh greenback into the global banking system, we are right back to where we were in 2008. Namely, deflation.
If I'm right about this, what should we be seeing across the global financial markets? Mainly three, simple trends:
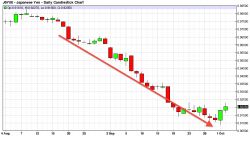
And what do we see? Let's start with the dollar. If we go back to mid-late August, what do we find?
The US dollar as measured by the POSX:
The euro and yen:
OK, those charts seem to verify bullet point #1.
How about the U.S. bond market? Are bond prices rallying, too? Well not at first and, while they were falling, they were the "missing link" in this equation. Ahhh, but look what happened two weeks ago! Bond prices suddenly reversed and prices began to rally...sharply. In fact, yields on the 10-year note and the 30-year Long Bond are now back to within a few basis points of the 2014 lows seen on August 28.
So, whaddayaknow? The change in trend and rally from mid-September seems to be verifying bullet point #2!
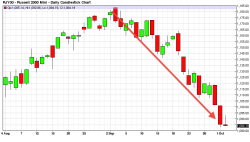
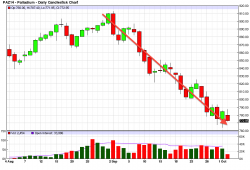
I guess that means we should now consider bullet point #3. Is nearly everything else falling? See for yourself:
U.S. stocks as measured by the S&P 500 and Russell 2000:
The most important "commodity" in the world at present, crude oil:
And all five metals:
Hmmm. Well those charts certainly seem to confirm bullet point #3.
So, here's the point:
IF I'M RIGHT ABOUT THIS, things are going to get even worse before they get better. Why? Because hardly anyone else is talking about it! By the time the world outside of Turdville finally figures out what's going on, the stock market will be crashing, crude will be near and the metals will be even lower, particularly silver.
The point is this:
As things begin to unravel in October and November, The Fed will be forced to act. Remember, their primary stated mission is prompt employment and inflation. Deflation is their number one enemy and they will do anything (and this includes QE4) to avoid it! After or slightly before this deflationary bias finally runs its course, all of the "dollar-based commodities" listed above will bounce, turn and rally back higher. Until then, however, we must expect continued pressure, even on gold. And if 80 gold gets taken out, there will even be spike downward as sell-stops get run below the current range, similar to the events of April 2013, though not quite as dramatic.
In the end, this means you must be mentally prepared for what lies ahead. The next few weeks are going to be increasingly volatile and panic-filled, not just in the metals but across the board. Recognize it for what it is and realize that your stack of physical will be just as shiny and valuable with each passing day, regardless of the changing paper price. As I've been stating for weeks, at The End of The Great Keynesian Experiment, the paper price shenanigans/machinations of September 2014 will be long forgotten. You should continue to use this time wisely and prepare accordingly.
TF


