As other outlets catch on to the gold--yen link, I thought we might discuss it a bit more today.
First of all, my apologies for sounding like a broken record. It is not my intention to beat this topic to death on a daily basis. However and for now, IT IS WHAT IT IS and we have to deal with it. Additionally, I am convinced that this persistent correlation might hold the key to finally stressing the paper---physical connection. GOFO rates in London fell even further in London today, making new 15-year lows in the process. This is always a sign of physical delivery stress and, to me, indicates that The Bullion Banks are having extreme difficulty sourcing metal to deliver at these noneconomically-derived paper prices.
And it continues to appear that we are seeing this stress play out in real time on the price charts. Notice that since last Friday, the paper price of gold has broken cleanly above the JPYUSD. It hasn't yet drawn completely way but it hasn't fallen back into complete overlap, either.
Apparently we're not the only ones who have noticed this, though I must say that it surprises me that so few have caught on. ZeroHedge wrote up a summary last night where they laid the correlation at the feet of the BoJ: https://www.zerohedge.com/news/2014-11-12/did-boj-quietly-peg-yen-gold
I don't agree with their conclusion as it grossly overstates the size and complexity of the Comex paper gold market. What I mean is...It doesn't take a formal central bank peg to link gold to the yen. Remember, "prices" are set on the Comex by just a small handful of HFT algo hedge funds trading against an even smaller number of bullion bank desks. If the majority of these computer-driven funds are programmed to sell gold with every downtick, gold is going to follow the yen. Period. No central bank intervention is needed.
And you've heard me state that although this gold-yen correlation came into prominence in 2008, it only really got sickeningly tight in June of this year. Want more proof of that? Then check out the next two charts...
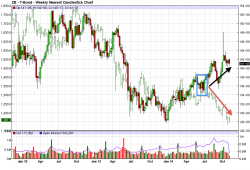
First, here's three years of a similar linkage that I've discussed often in the past...the rational and economic link between gold and The Long Bond. Again, why is this rational? Lower interest rates make gold, which "doesn't pay interest and is a useless relic" more attractive. Note the clear correlation until...you guessed it, June of this year:
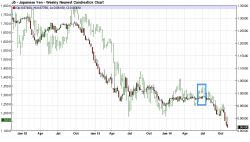
Now look at three years of the yen-gold link. Notice the same loose correlation until June 2014 and then, WHAM! Ever since they are perfectly 1:1.
So, why did this happen? What changed in June to prompt this break of the gold-LB and accelration of the gold-yen? Who can say for sure? Maybe ZH is right and the BoJ started running an operation in June in anticipation of the increase in QE announce two weeks ago. Maybe. All I know is that it clearly is what it is and until the paper---physical link causes the correlation to break, we will likely see gold move even lower as the yen moves lower.
To that end, read this. More from SocGen's Albert Edwards. This time, instead of forecasting the USDJPY rising to 120, he's now saying 145! YIKES!! If the gold-yen correlation doesn't break before then, what would gold be at yen 145? $900? $700?? https://www.zerohedge.com/news/2014-11-13/most-important-chart-investors...
Again, I don't think this will happen for two, primary reasons:
- The physical market will break from the paper price well before $700 gold.
- The Fed has to understand that global disaster that a 145 yen and an 80¢ euro would bring. I simply cannot imagine that they wouldn't act to malign the dollar if the POSX begins to even exceed 90, much less 100 or 110.
So, anyway, all of this is pretty crazy stuff but it's what we get since we've allowed all global markets to become such computer-driven shams.
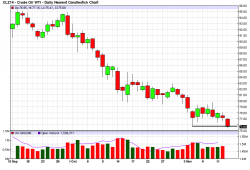
I need to mention crude for a moment. We discussed in yesterday's podcast that the chart looked lousy and it appeared that another breakdown was coming. Well, we didn't have to wait long. Hot on the heels of another Saudi pronouncement (covert Russian sanction scheme), the price fell to new lows for this move at $75.43 and I have a last of $75.70. Though $75 can and will offer some support, I still think that the greazy stuff is headed to $70. So far, today's move has not dragged silver lower and this could be a growing sign of physical silver tightness...just like what we're seeing in the gold-yen growing divergence. We'll need to watch this closely, too.
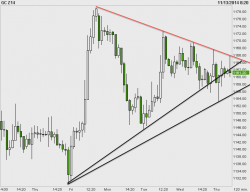
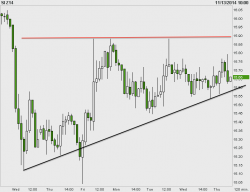
Finally, here are some two-hour charts of the metals, for what they're worth...
That's all for now as I need to get ready for A2A within the hour. As usual, I'll post a recorded copy of the presentation shortly after it concludes.
Have a great day,
TF

