Again, there is NO ONE who dislikes the criminal co-conspirators of the CFTC more than yours truly and, of course, the reports they construct may all be total hogwash that's designed to mislead as many as possible. Today, though, let me remind you of the data so that you can make your own, informed decisions.
What prompted this post is two items:
- The plethora of "CoT analysis" that's out there
- The notion that the CFTC-generated data can't be trusted
Let's attempt to address both of these items...
First and foremost, it's is entirely possible that the data is nothing but a complete joke. JPM was fined in 2014 for repeatedly supplying the CFTC with false and inaccurate data: https://www.cftc.gov/PressRoom/PressReleases/pr6968-14
Additionally, we know that The Banks are involved in all sorts of OTC and off-books trades, the size and scope of which could dwarf the positions reportedly held on the Comex. So, any positions shown on the Comex may not even be half of the overall picture.
And too many recently-baptized CoT analysts fail to understand both of the points above and take the data as if it's all pristine, precise and all-revealing. It's not.
Now, on the bright side, the CoT is a zero-sum report where the total amount of longs must equal the total amount of shorts. And they do, every week. So, maybe that adds a shred of validity.
And at the end of the day...and as we've maintained here since the beginning...the CoTs are helpful only in a backward-looking and historical sense. If you can line up the historical data with the charts, you can begin to see clear patterns. THIS ALONE IS THE VALUE OF THE COT.
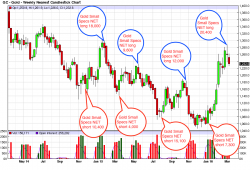
To that end, I thought I'd reprint and update the charts below. First, the recent history of the "Gold Commercial" NET short position. At its highs in 2012, this position grew as large as over 250,000 contracts net short. At its lows in December of last year, the CoT showed a Gold Commercial NET short of just 2,911 contracts and we were quite certain at the time that the number had slid into net long a couple of times intraweek.
Again, though, the primary value of the CoT is in its historical perspective. As you know, its the Gold Cartel Banks that control and manage the gold price on Comex. To that end, you would expect to see them heavily net short at the end of rallies, only to use Spec long liquidation to buy back and cover shorts into bottoms. Is that what you see below?
However, we all know that The Banks are nothing but soulless, godless, lying thieves who are not to be trusted. Therefore, why should we trust the data shown above?
To that end, let's also plot the summary position of the "Small Speculators". These guys are the ultimate outsiders. They read their charts and go with the momentum and their gut...and they are almost always wrong. Also, this data is provided by broker-dealers which are scared shitless of the CFTC and any federal "regulator". As opposed to the protected TBTF Banks, the last thing these B/Ds are going to do is lie and deceive the CFTC. I'm quite confident that they report accurate summaries of their clients' data when called upon to do so.
And what does a chart of the Small Spec positions show? See below:
So, again, you can write this off if you want. It doesn't bother me one bit if you do. My job is simply to make you aware of the historical extreme. Could the report be utter nonsense, fabricated in a Washington DC cubicle by a porno-watching and burrito-eating bureaucrat? Of course! Maybe the whole thing is a simple fabrication. But, if it's not, then you need to be cautious here as history certainly suggests that another "CoT Wash & Rinse Cycle" is pending.
TF


