Time is short but I do have something interesting for you to consider today.
Look, there's a lot going on that will make tomorrow's gold (and silver) "market" different from yesterday's. Regardless, I still believe it's useful to look at yesterday's market in order to forecast where we might be going based upon where we have been.
Today, we're going to look at the Continuous Commodity Index. https://en.wikipedia.org/wiki/Continuous_Commodity_Index. Here's a little background info from the Wiki page:
"The 17 components of the CCI are continuously rebalanced to maintain the equal weight of 5.88%. Since CCI components are equally weighted, they therefore distribute evenly into the major sectors: Energy 17.65%, Metals 23.53%, Softs 29.41% and Agriculture 29.41%. While other commodity indices may overweight in certain sectors (e.g. Energy), the CCI provides exposure to all four commodity subgroups."
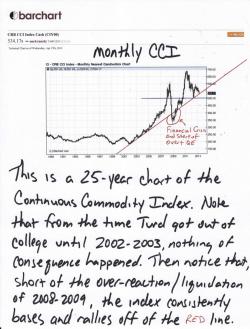
So, first, let's look at a 25-year chart. Some of you may not even have been alive at the start of this chart. Personally, I was just graduating from college and chasing my then-sweetheart to San Francisco. (That's an interesting story but we'll save it for another day.) The point is: This chart covers a lot of ground and time. Therefore, it is to be respected.
Notice that for the first half of the chart, the action is sideways. From 1988 to 2002, the index fluctuated in roughly a 50-point range. Though there was some action in individual commodities from time to time, overall the sector was a real yawner. The sideways action actually goes back even further, to the early 1980s, when interest rates were raised to choke the money supply and curb inflation. So, for roughly 20 years, commodities in general sucked.
Then what happened? The debt-induced easy growth of the 90's finally popped in 2001 and it has been off to the races for commodities ever since. Sure there have been pauses and corrections along the way but there also been periods of blowoff, parabolic rallies, too. In the end, though, the trend has remained. Here, see for yourself:
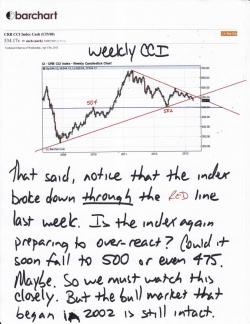
So now let's look a little closer. On the five-year, weekly chart below, you can see where we currently stand. Of course, I've tried to draw the trendline as accurately as possible but it's impossible to show exactly where it currently lays. Needless to say though, we're pretty much right on top of it. So there are three things to consider:
- First and foremost, is this 11 year bull market in commodities over? Did commodities go sideways for 20 years only to have a bull market end after just 10 years? Look at it another way...Have the fundamental conditions which prompted this bull market changed? Are the Fed and other central banks about to embark on a Volcker-esque tightening spree?
- Could commodities in general (and, by extension, gold and silver) bounce and rally right here and right now, just like they did the on the last two occasions they encountered the main trendline in late 2008 and mid 2012?
- Are commodities about to over-shoot again, similar to the circled area on the monthly chart above? If so, could a final drop toward 500 or even 475 be in the cards? IF that were to happen, what would be the short-term impact on the price of gold? Of silver? Would you finally capitulate/panic and sell or will you rely on your answers to the questions posed in point #1 above?
OK, gotta stop there but that should give you plenty to think about and discuss for a while. Have a great day and let's hope that CIGA BoPolny/BoPelini/BoDiddley/BoJackson is proven correct.
TF


