The US labor force is rapidly shrinking. Wage growth is non-existent. The vast majority of the American people have no savings and little hope for economic improvement. But none of that matters with the G-3 central banks in charge!
So today saw the latest installment of the BLSBS. If you check your "mainstream" sources, you;ll be led to believe that everything is great and getting even better!
But look under the hood and you see that this is all bullshit. The unemployment rate that Drudge blares on behalf of Trump is only at its "lowest since 2000" because October saw an astonishing 968,000 people leave the labor force. This leaves the total number of people NOT in the labor force at a record 95,385,000. Then, as ZH notes, "this took place as the number of employed Americans declined by 484,000, however since the unemployment rate denominator dropped more, it translated into an actual decline in the unemployment rate!" Read all about it here: https://www.zerohedge.com/news/2017-11-03/people-not-labor-force-soar-re...
Secondly, about this notion of "hiring bouncing back" and the "economy rebounds". Do you recall this very prescient chart from Morgan Stanley? Well, the two hurricanes messed up the math BUT, since this BLSBS is all about "catch up", let's take another look:
If this chart had continued to be accurate (no hurricanes), the combined total of "new jobs" for September and October would have been 345,000. And what was the actual total? September was revised today to +18,000 and this latest report had October at 261,000. That's a total of 279,000. Hmmmm. How about that for your "rebounding" economy and job market?!?
And the wage growth component was terrible, too, with wages FLAT month-over-month and coming in at a growth of just 2.4% year-over-year. This includes all of the high-end, top-salary types so can you imagine what the actual wage growth is for the vast majority of Americans who actually do all the living, working and dying? Try close to ZERO!
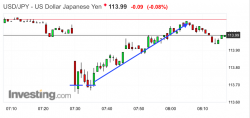
But, of course, here's the thing. When the G-3 central banks attempt to control everything, none of this matters at all. In typical G-3 fashion, the all-important USDJPY sank on the news, it immediately double-bottomed and then moved higher at 45 degrees until it was right back to where it was at 8:29 EDT.
And as I type, nothing has changed in the time since. The USDJPY has continued to creep higher and I have a last of 114.10. CDG had nearly hit 80 but it's back to 76 and CDS is now down 4¢ at .10.
So, in the end what happens? As per usual, average and everyday Americans continue to get squeezed as they work multiple jobs attempting to feed their families and pay their taxes. The filthy rich and Wall Street bankers line their pockets with ill gotten profits derived from the endless creation of fiat cash by the central bankers.
Oh, and don't forget that you're now repeatedly told about how "the Fed is tightening" and how this "makes the dollar stronger". Yes, the dollar appears stronger but that only because other fiat is weakening even faster. Don't believe me? Well check The Fed's own charts! M1 and M2 money supply are both at all-time highs!!
And here's a fun, little "anomaly" for you. Below is the same M2 money supply chart but I've added the price of Comex gold. The scales are off and this makes the chart a bit difficult to read. However, you can plainly see that, beginning in the fall of 2011, something changed. After tracking money supply growth pretty closely since 2002, there seems to be a bit of a disconnect. Gee, I wonder why and how?
But, whatever. It is what it is and as long as The Criminal Bankers remain in charge, not much is going to change.
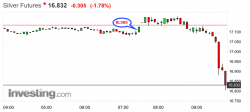
To that end, look at what has happened to CDG and CDS while I've been typing! Though the USDJPY is still 114.10, suddenly prices are getting smashed lower. And why not? Again, when The Bankers control everything, they can pretty much do whatever they want.
So we'll have to see where we finish the day. It certainly appears that this onslaught has been designed to take out the 200-day MA on a closing basis. For today, that level is $1268.40 so watch it closely.
TF


