With the metals down again today, I thought it was time to spread some information, not misinformation or disinformation.
The common MOPE regarding the rising U.S. stock market and potential Fed "tapering" is that finally, after four years of fits and starts, the U.S. economy is recovering and growing based on the improving economic statistics and burgeoning housing recovery. So is that really the case?
Yesterday, we discussed the fallacies of the latest BLSBS data and, as any regular reader of ZeroHedge knows, over the past 90 days almost every key metric of economic activity has "disappointed". Just today we had:
- Rising initial jobless claims. This puts the claims numbers at an almost identical level to last year at this time. https://www.zerohedge.com/news/2013-05-16/tragic-trifecta-initial-claims-soar-housing-starts-plunge-cpi-below-expectations
- Plunging housing starts. More on that in a minute.
- A lower-than-expected CPI.
- Completely lousy Philly Fed numbers.
And, again, that's just today. The meme is that everything is finally getting better. Really? Really?? Hmmm. Let's go back to that housing starts thingy. As discussed yesterday, there's a certain LAW called The Law of Supply and Demand. For those who failed Econ 101, think of it in terms of a chart with a vertical axis and a horizontal axis. In it's most basic form, it looks like this:
What this is showing you is that price exists at the intersection of supply and demand. If you increase the supply or decrease the demand of an item, the price equilibrium is reset lower and price falls. Conversely, decreasing supply or increasing demand has the impact of raising prices. (See, it's not complicated. Maybe if you had spent more time studying and less time at the bar, you might have had a higher GPA!)
So, what does this mean for our supposedly robust housing recovery? While admitting that this is not the be-all-end-all, these four charts should be enough to give you pause and prompt you to consider whether the mainstream media is giving you the facts or just a heaping pile of MOPE.
If you're going to build a house, an apartment complex or an office building, you need to acquire a number of things. Most of the process is summarized quite neatly by Thornton Mellon in the clip below:
For the purposes of this discussion, however, let's keep it simple. For our house, we'll need lots of lumber for construction, copper for wiring and plumbing, aluminum for all the HVAC stuff and steel for the support columns and crossbeams. Again, price is a function of supply and demand so one might expect that a "robust" housing sector would be causing increased demand for these raw materials. One might expect that but one would be wrong.
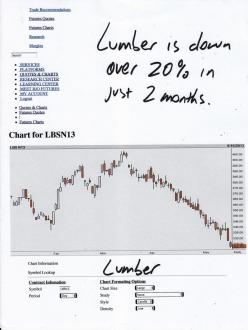
Let's see, how's that lumber market doing?
And I think we all know that ole DrC hasn't been doing too well, either...
Uh-oh. Zero for two. Maybe aluminum and steel are faring better? Nope.
Ahh, but what do I know. I'm just a dope with a MacBook (that's for Turdle ). But it sure looks to me that there isn't much of a housing recovery going on. And if there isn't a housing recovery, then the U.S. economy isn't getting any better. And if the U.S. economy isn't getting any better, then tax revenues won't be increasing. And if tax revenues won't be increasing, then the federal deficit won't be falling. And if the deficit isn't falling, then the Fed will have to keep propping up the bond market. And if the Fed has to continue propping up the bond market, the idea of them "tapering" is simple nonsense. And if tapering is nonsense, explain to me why the metals are once again falling this week.
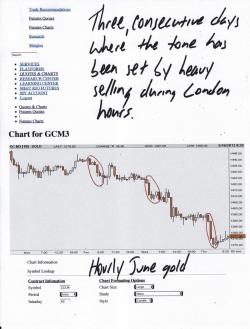
Well, the past three days, it's all started in London. I think I recall that Ranting Andy has a term for this action but I can't remember what it is. What I do know is that when the selling starts at 2:00 am New York time and carries on until about 7:00 am New York time, the selling is originating in London. And who's in London? Just the bullion banks, that's all, doing their dirty deeds to slant the market in the thin, pre-Comex trading, trying to set the tone for the spec momo HFT money to come charging in at the 8:20 EDT Comex open. It's not complicated and it's all right here for everyone to see:
For today, at least, their efforts have been thwarted by all the crappy economic news and we've got a bit of a bounce on our hands. (That hat is still looking tasty, though.) Maybe, just maybe, we're getting a double bottom painted onto the charts? We'll see. Time will tell.
One last thing to discuss today. You know, back in the day, over two years ago when silver was soaring, there was a lot of talk about Comex defaults and commercial signal failures. I have to admit being sucked in a bit by this back then. Obviously, it didn't happen and I've since been very wary of this kind of talk. Again, if we've learned anything these past three years or so its that the primary power held by TPTB is the power to postpone the inevitable. That said, the Comex gold inventory numbers are really beginning to capture my attention on a daily basis.
We discussed this a bit yesterday but it's worth going over again today. After JPM reclassified another 160,000 ounces of gold from Registered (able to be used to for contract delivery) to Eligible (not ready for delivery), the TOTAL Comex registered inventory fell again yesterday and it now stands at just 1,676,000 troy ounces or about 52 metric tonnes.
Recall that every Comex gold contract is for 100 ounces. This means that the Comex registered vaults only have enough gold on hand to physically settle just 16,760 contracts. Big deal, you say. So what, you mutter. And you may be right. Most likely, The Shell Game & Charade will continue through the clever reclassification of more than enough rehypothecated gold from Eligible to Registered. OK, maybe. But chew on this for a minute.
The first "delivery" month for gold this year was February. That month, the total number of contracts standing for delivery totaled more than 13,000. This was somewhat odd in that that was nearly more than August, October and December of 2012 combined. That got my attention. Then, when April delivery rolled around, just 6,600 initially stood for delivery. Crisis passed, right? February was just a one-off. An outlier. Uhhh, nope. Over the course of the month, money continued to flow into the April contract for immediate delivery. These buyers were ponying up 100% margin and "jumping the queue" to some extent in that they were seemingly unwilling to wait for June. In the end, when it was all said and done, the Comex ended up delivering to 11,632 contracts in April.
And now here we come toward June. First Notice Day for the June contract is two weeks from tomorrow, the 31st. Again, on that day, the June13 stops trading and all contract holders must put up 100% margin in order to indicate their intent to take delivery. As of yesterday, the total open interest in the June contract was still 200,477. No doubt the vast majority of these are paper traders who, as we approach the end of this month, will sell or cover and roll into August. However, some will hold, intent upon taking delivery. (Maybe if you're Shanghai and you're currently completely cleaned out of gold in your vaults, you might take delivery of a few contracts? Hey, a guy can hope, can't he?) Of course, the question is, how many?
Again, as of this moment, The Comex only has enough Registered gold to settle 16,760 contracts. For some perspective, when we were 11 days out from FND for the April contract, the OI for April was 196,135. When we were 11 days out for the Feb13, the OI was 200,441. So, having the current June OI stand at 200,477 tells us very little. However, we must watch this very closely in the days ahead. Let's keep an eye on Comex vault changes and compare that to the daily drawdown of June open interest.
OK, that's all for today. Once again I plead with you to keep the faith and stand defiant. The laws of supply and demand are currently impacting paper metal which, in turn, impact the price of physical metal, too. This cannot and will not last forever. Hang in there.
TF


